.gif)


.gif)

Datore – EMEX 2022 | Focus Interview
Datore is a business intelligence platform that provides visual analytics and AI solutions to allow companies to optimise their energy usage and sustainability...
Read Full Article.png)
The Leading News & Information Service For The Facilities, Workplace & Built Environment Community
You cannot manage what you cannot measure, and ClearVUE. PRO provides deep levels of energy consumption analysis to help you transform your business energy profile and make savings along the way.
The deep level of analytics on your consumption and power usage lets you see just how much energy you are using and, in turn, how much money you are spending on your energy.
ClearVUE. PRO delivers energy data to you at speeds not found in any other energy management system. Your energy data is available to you at the click of the mouse. Additionally, it feeds in live and accurate costs to the application’s dashboard and data graphs.
When running a business, you will have questions about your energy consumption, such as are we spending too much on our energy? Are we wasting power on certain assets? Can our efficiencies be improved? These and other questions can be inquired and, most importantly, answered with ClearVUE. PRO.
ClearVUE energy management system is part of the Global Procurement Group brands which includes the UK trading arm Northern Gas and Power – the leading UK energy procurement specialist. ClearVUE is a global offer that allows businesses to visualise their energy use in real-time, spot anomalies and waste, while also prioritising the best time to use energy and how to target and reach net-zero goals.
Our system has troves of features and tools that uncover profound insights of your business’ energy profile. Here are five practical ways that you can use the ClearVUE. PRO energy management system and the five important questions about your business energy usage that can be answered.
ClearVUE. PRO equips you with the data you need to make business-altering decisions.
Upon first using ClearVUE. PRO, your energy trends will become quite evident to you. You will quickly discover your sites’ energy profiles, and anomalies and troubling-high trends will stick out to you.
Consider the following case study from an actual ClearVUE. PRO customer. The customer – a garden attraction in the UK – analysed their consumption data through the History Analysis page of the system. What immediately stood out to them was that their site was taking a significant amount of power from the grid during closing hours. Even though their features, attractions, and basic utilities were shut down or tempered down during the night, their entire site was still drawing quite a bit of power – 200 kilowatts to be exact, equating to £400 per night. Why was this the case?
By investigating individual circuit consumption on the data graph in ClearVUE. PRO, the customer discovered that one of their main attractions, even though it was “shut off”, was using upwards of 30 kilowatts throughout the night – to the tune of around £45 per night. That is over £16,000 for the year!
Armed with this data, the customer could adjust their operational practices to significantly reduce how much power the attraction was drawing. Their alterations reduced the cost of powering it during the night down to just over £11. This translated to a £10,000 per year savings just from one asset!
Because ClearVUE. PRO can present consumption data to you so quickly and at incredible levels of depth, investigating your energy consumption trends will result in immediate dividends for your business.
You can load data immediately for all or a combination of your circuits from your sites, and at any point in history, at the click of a mouse. With your mouse, you can zoom in as close as a few hours of consumption data and zoom out as far as the entire year or longer. In no time you will identify anomalies and patterns in your energy data that may be costing you far more pounds than necessary.
A report on costs updates immediately as you drill down into the data. For example, you can zoom into a particular night when business operations are closed and see how much you are spending on dormant energy usage. You may notice that some circuits are still taking significant amounts of energy. Having this knowledge means you can act in real time, altering operationally so you can save money.
Just as fast as ClearVUE. PRO lets you analyse your consumption data, it can just as quickly calculate costs of your energy spend in the data table below. No other energy management system provides live and accurate costs as you delve into your consumption data.
As you explore your historical data, the parameter units in the data table below will show the value of those units for the data present in the graph. One parameter that will be of special interest to you as a business owner is costs.
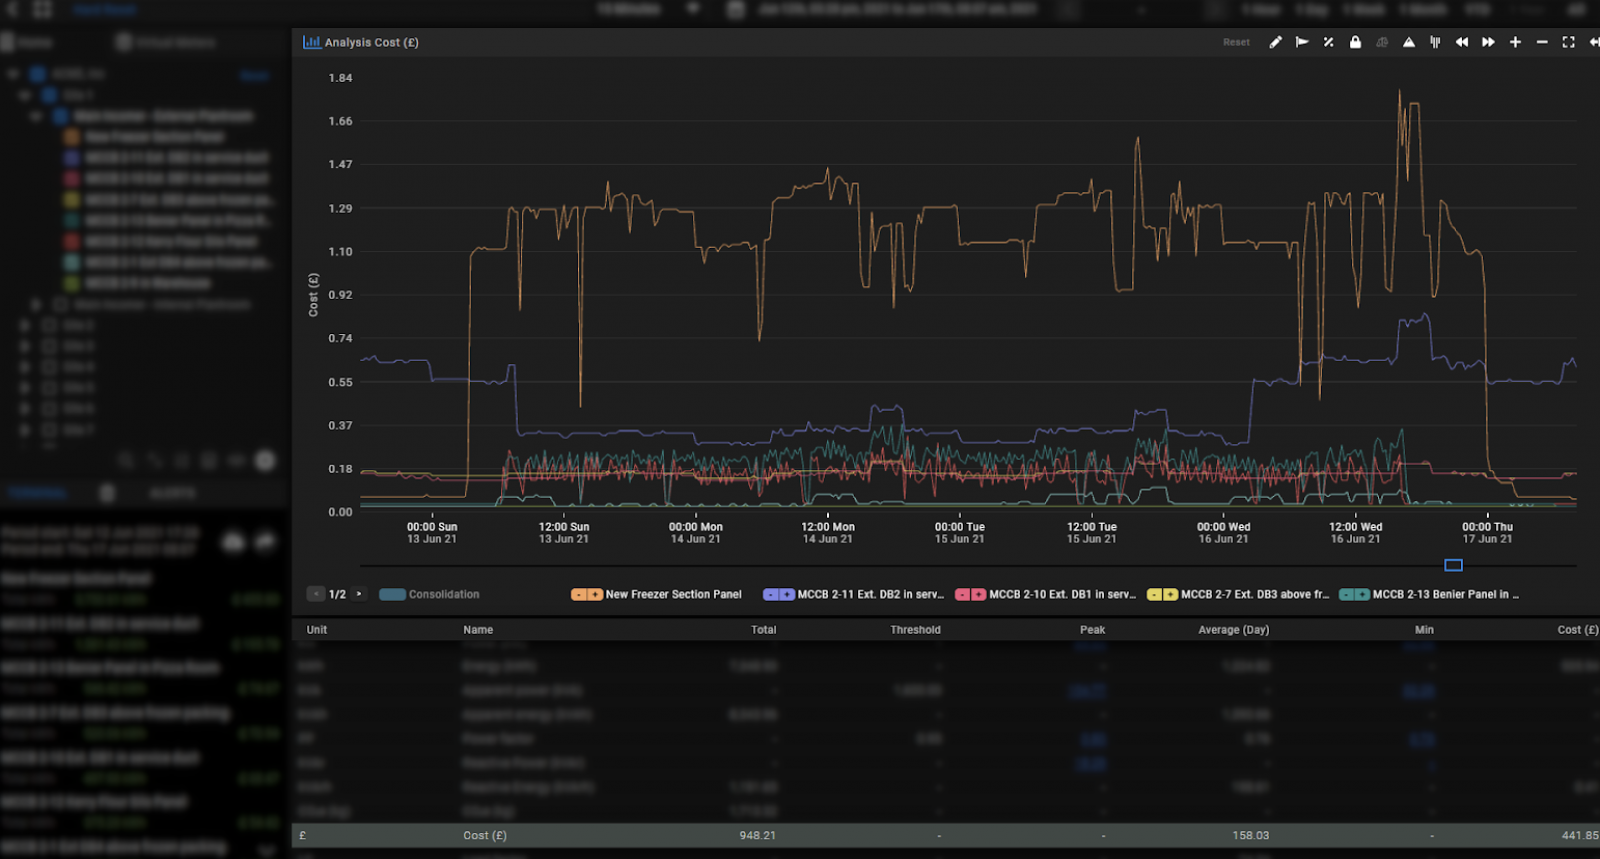
Picture: a photograph of a screenshot from the ClearVUE. PRO dashboard showing energy cost data
This means that you can, for example, highlight any period in the data to reveal how much the selected meters or circuits are costing your business. Can the cost of powering assets and buildings during the night or closing periods be reduced? Is the cost of power load during peak production times what you expect to see? These and other kinds of cost-related questions can be answered thanks to the live and accurate costings engines running on your ClearVUE. PRO system.
It can be expected to spend money on energy during busy operating and production times, but are you wasting energy and money by overpowering your assets during downtimes? ClearVUE. PRO gives you the tools and insights necessary to uncover these kinds of instances and thereafter helps you alter your operational patterns, resulting in savings.
The peak feature in ClearVUE. PRO pinpoints the exact moment when your site exerted peak power within a selected period. You can then choose to show all active circuits running at that time. Now you can see what was consuming the most amount of power.
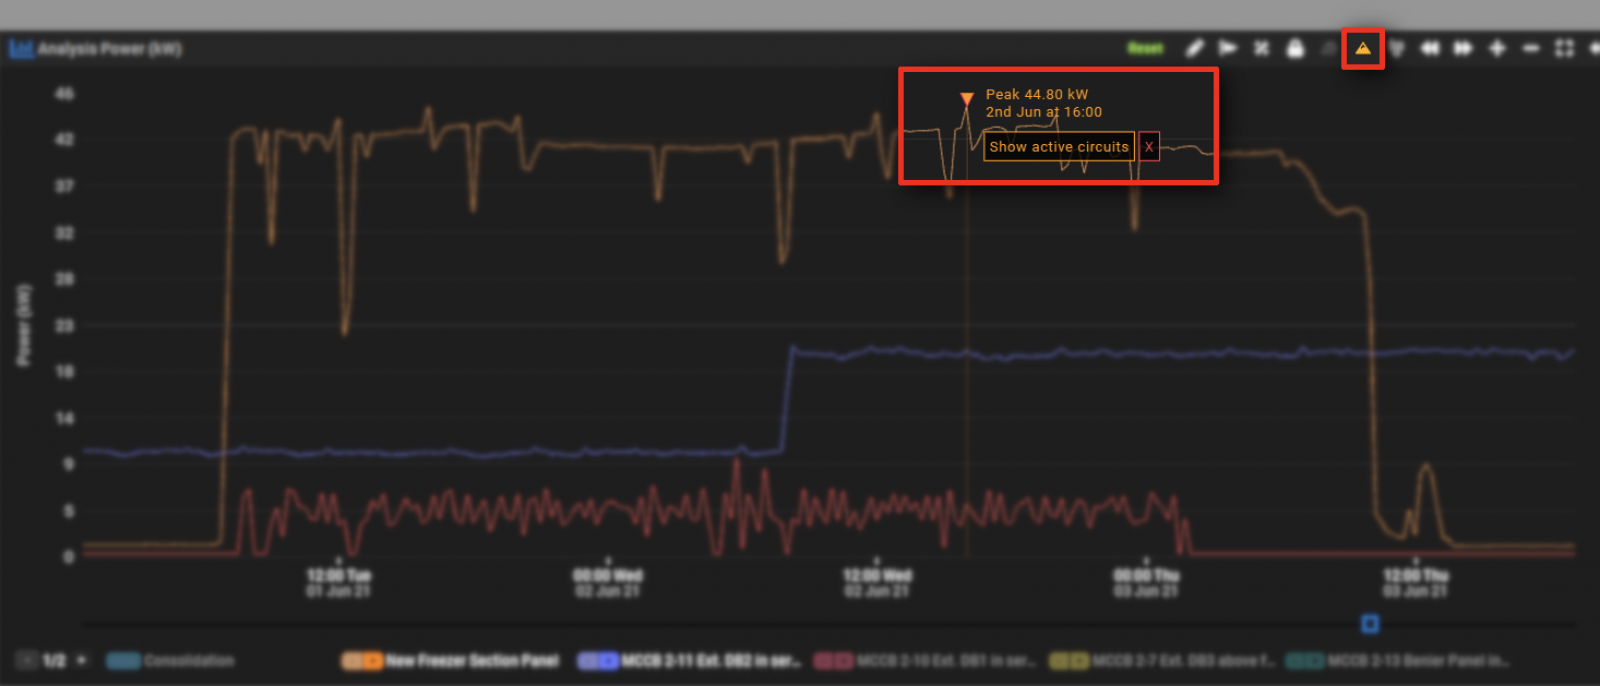
Picture: a photograph of a screenshot from the ClearVUE. PRO dashboard showing energy peaks
This is a helpful tool to use when you want to verify that the peaks in your energy data coincide with your peak operation hours. If at 10 am your machinery is running at max capacity, and the peaks in your data confirm this, then all is good. However, if the peaks in your data are during lower production periods, you then have the measurements needed to fine-tune your energy management practices.
ClearVUE. PRO helps you use your business energy in smarter and more efficient ways.
Choosing when to draw more power from the network makes a difference in your monthly energy spend. Drawing energy from the network is more expensive when the grid is under the most duress. If you have a pass-through contract with your energy supplier, this means that you will be paying more for using energy when the grid is under stress from high distribution.
ClearVUE. PRO lets you easily and quickly analyse your energy trends during these periods. The red-amber-green (RAG) toggle in the History Analysis page overlays your data graph with the zones that represent the peak and non-peak periods of the grid.
You will see your meter’s actual RAG periods. Hover your mouse over the different zones will report to you the distribution and supplier charges for that time. Of course, you want your high consumption periods to avoid the red zone, which is when network charges are the highest.
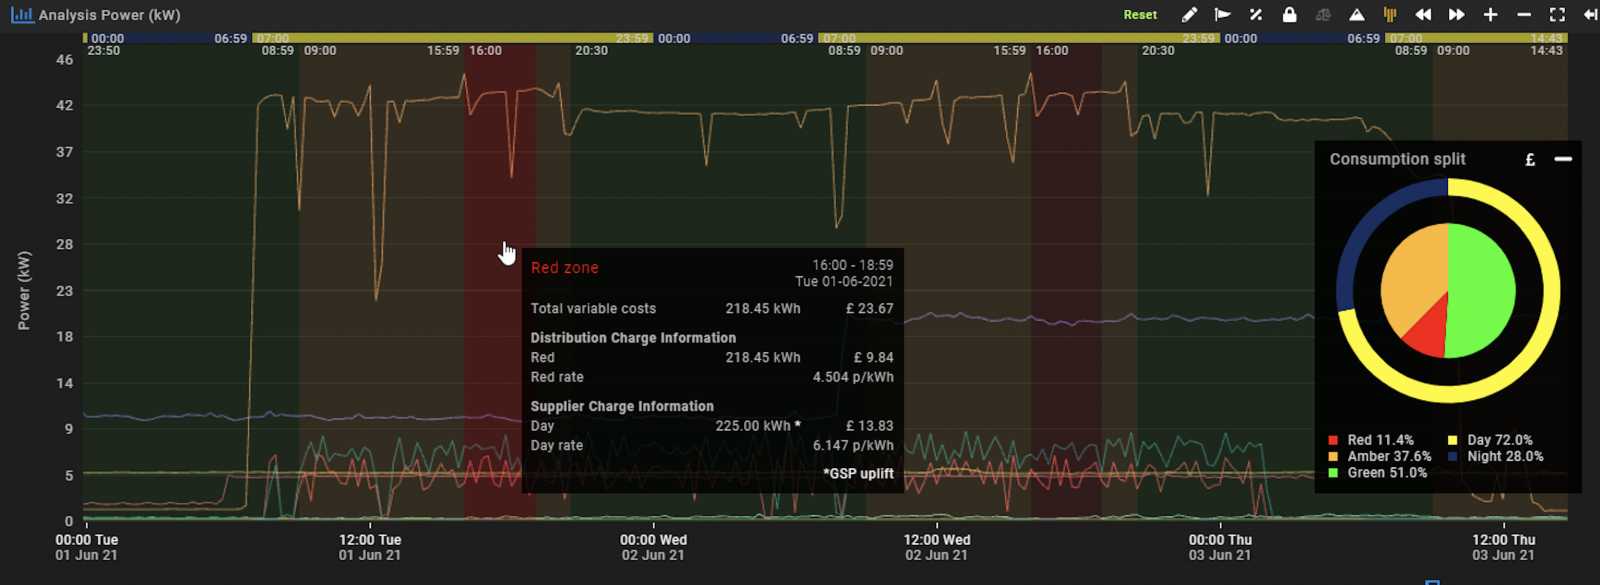
Picture: a screenshot from the ClearVUE. PRO dashboard showing consumption trends between day and night splits
You can also see how your consumption trends are faring between day and night splits.
The pie chart in the application displays your consumption split and variable charges split for the selected period.
A virtual bill that breaks down the commodity and non-commodity costs can be printed from the Terminal panel.
With ClearVUE. PRO, you are not limited to examining consumption data from your actual meters. You can create custom meters – or virtual meters – to evaluate how particular operations across multiple sites are performing.
Virtual meters in ClearVUE. PRO lets you compile a custom list of circuits that you can then analyse in the same manner as you regular sites and meters. Creating a virtual meter grants you the ability to group circuits from any of your sites that perform the same job.
You can create any number of virtual meters as you need. The limitless possibilities of creating custom lists of circuits gives you unlimited variety in cost and performance analyses for your business.
Having the answers you need to improve your business operations and energy profile cannot be found unless you have meaningful data on hand. ClearVUE. PRO delivers data of your business’ energy consumption at speeds and at levels of detail unmatched by other energy management systems. On top of that, you get live and accurate costings of your energy usage, so you do not have to wait for your next energy bill before expensive energy bills compel you to change operation patterns.
If you are ready for ClearVUE. PRO for your business, contact us today.
Picture: a photograph of a person sitting in front of the ClearVUE. PRO dashboard screen on a desktop computer
Article written by John van Vliet | Published 10 November 2021
Datore is a business intelligence platform that provides visual analytics and AI solutions to allow companies to optimise their energy usage and sustainability...
Read Full ArticleJohnson Controls and Asset+ recently partnered with Hounslow Council and achieved a 50 per cent reduction in carbon emissions in schools and public...
Read Full ArticleSpace4Climate gathers the UK’s Earth Observation community focussed on researching and delivering trustworthy environmental data in support of climate action. We...
Read Full ArticleENERGAIR, the sustainable compressed air management arm of Belgian-based compressor controls specialist CMC, has announced plans to provide a virtual reality experience...
Read Full ArticleEnergyElephant will be unveiling their new real-time data module at EMEX on Wednesday, 23 November. Due to strong customer demand and requests from existing users,...
Read Full ArticleAhead of EMEX 2022, catch up on the Focus Interviews from last year’s conference. EMEX 2021 came at a pivotal time. As the business world returned to...
Read Full ArticleThisWeekinFM is returning to EMEX 2022 as the Headline Media Partner, holding video interviews across the two-day net-zero conference. On Stand H56, ThisWeekinFM will...
Read Full ArticleFor property landlords in the commercial sector, the managing and monitoring of water consumption is an important yet lesser-considered factor in ESG...
Read Full ArticleAs part of our EMEX Focus Interview series, meet Craig Mellor from Deer Technology, a Welsh-based product development and technology company. Deer Technology develops...
Read Full ArticleAndy Cooper, UK Sales Manager at Clarke Energy, joins us to discuss CHP technology and other energy solutions. Clarke Energy, a KOHLER Company, is a...
Read Full Article
.png)